KfW Funding Calculator by BuildSystems
| Date | 2024-07-30 |
|---|---|
| Organization | BuildSystems |
| Director | Martin Bittmann |
| Manager | Julia Dorn |
| Team | Daniel Nunes Locatelli, Daniel Dieren |
| Link | https://app.buildsystems.de |
Features
- Price estimation of a building: The app estimates the cost of a new construction or renovation based on publicly available data from Arge e.V.
- Loan Simulation: Accurate simulation of loans based on the price estimation and energy efficiency of a building.
- Energy metric inputs: Influencing the subsidy and loan possibilities.
- Data Security: Ensuring all user data is secure and follow EU regulations.
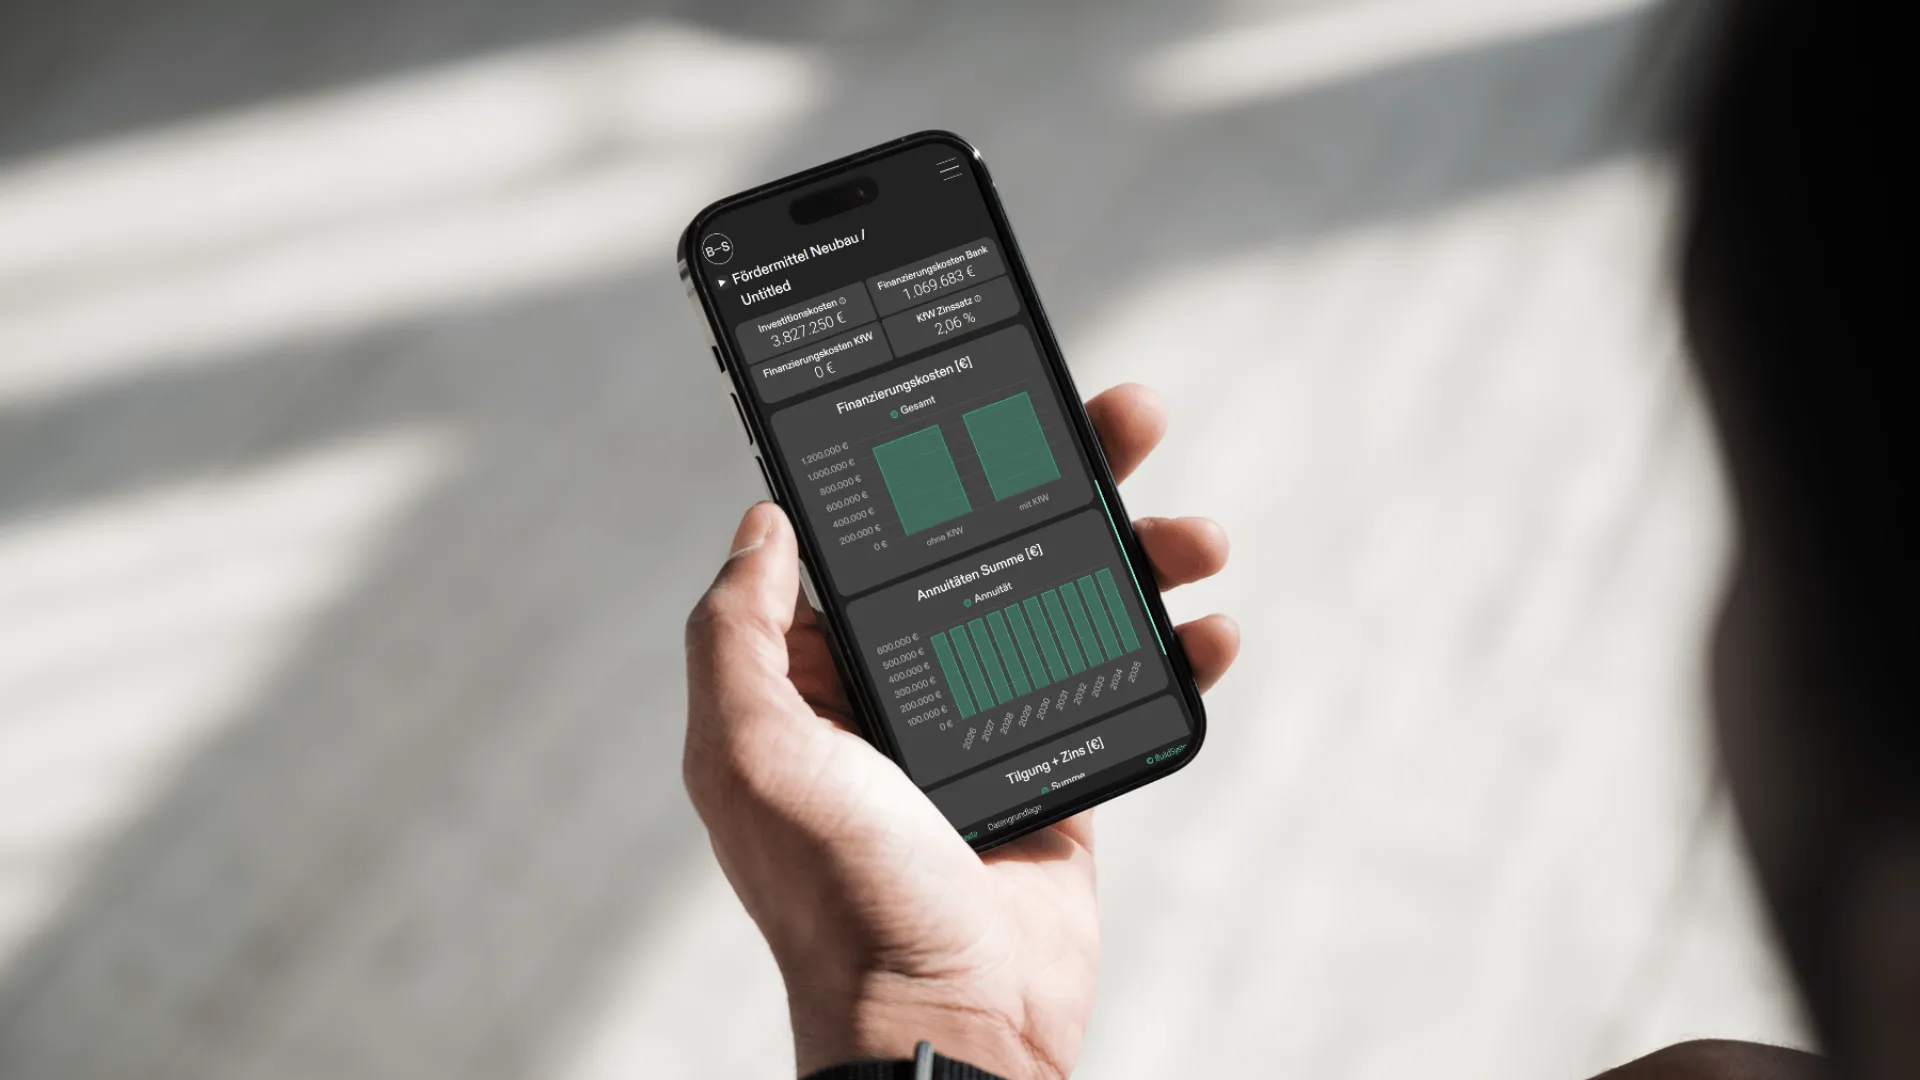
- Responsive Design: App works seamlessly across all devices.
Tech stack
- GitHub: For the Git repository.
- Angular: A modern JavaScript framework backed by Google and used for large-scale applications.
- ng2-charts: Angular wrapper for the Chart.js library. It is used to create responsive and interactive charts.
- Cloudflare: Hosting provider to ensure reliability and scalability, no initial investment is required.
Why did we build this toolbox?
Germany is known for pushing green tech, such as solar panels and wind turbines, through public subsidies. But did you know that there are also many subsidies for energy-efficient construction? Although these subsidies are attractive, navigating the bureaucracy can be incredibly challenging. This app developed by BuildSystems makes it easy to simulate a loan from the national bank KfW. It simplifies the process by offering a user-friendly interface, allowing real estate developers and homeowners to understand their financial options quickly and easily.
Development Process
The app development happened in three major phases. The Planning and Design, the Frontend Development and the Test & Quality Assurance.
Planning and Design
To begin the project, the whole team defined the requirements and variables for the app logic. Once that was settled, I sketched the frontend architecture and the UI/UX.
App logic
Daniel Dieren developed the app logic in Excel. My role was to review it, reverse engineer the formulas to ensure everything was correct, and suggest improvements. This step overlapped with the whole software development process because, as we advanced, we noticed that we could add more relevant information. I created a simple documentation on Notion from the Excel file to understand each formula thoroughly and make it easy to bring it to TypeScript later.
Frontend Architecture
Because the team already uses Figma, I decided to stay within its ecosystem. So, I used FigJam to sketch an initial software architecture diagram, thinking about which components would be necessary and the relationship between them.
%%{ init: { 'flowchart': { 'curve': 'basis' } } }%%
flowchart TB

	R(Routes) --> N & S & PO & PR & SE

	subgraph S[Sanierung Component]
		SF
		SS
		SOUT
		SSV
	end

	subgraph SOUT[Output]
		SD
		SCH
	end

	SF(Sanierung Forms)-->SS(Service)
	SS-->SD(Dashboard)
	SS-->SCH(Charts)
	SS-->SSV(Save)

	subgraph N[Neubau Component]
		NF
		NS
		NOUT
		NSV
	end

	subgraph NOUT[Output]
		ND
		NCH

	end

	NF(Neubau Forms)-->NS(Service)
	NS-->ND(Dashboard)
	NS-->NCH(Charts)
	NS-->NSV(Save)

	subgraph PR[Profile Component]
		CP(Change password)
		DC(Delete Account)
	end

	subgraph SE[Settings Component]
		CT(Change Theme)
		CL(Change Language)
	end

	NL-->NLD
	SL-->SLD

	NSV-->DB[(Database)]
	SSV-->DB

	DB-->SL
	DB-->NL

	subgraph PO[Portfolio Component]
		NL(Neubau List)
		SL(Sanierung List)
		SLD(Load)
		NLD(Load)
	end
UI & UX Design
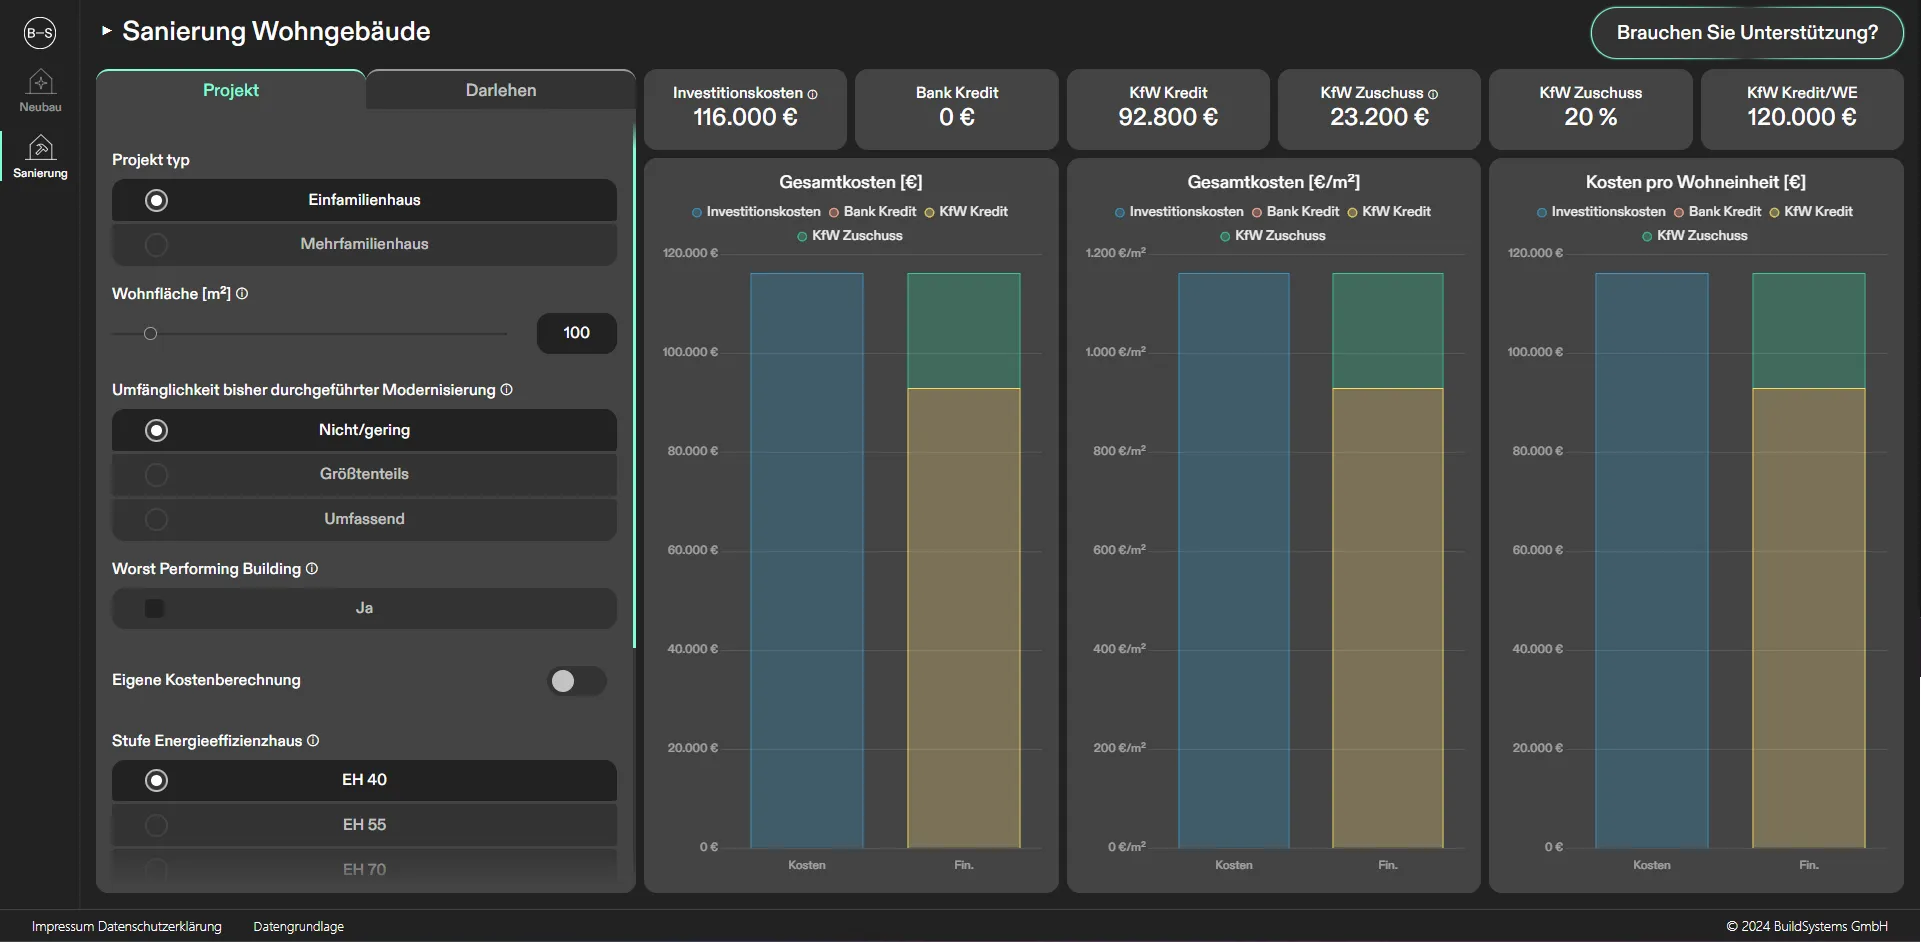
Conceptually, my approach for the design was to create a full dashboard with all the variables accessible by the user, without too much abstraction. At a later stage we aim at having another user flow where users have a step-by-step for simulating the loans. To create prototypes, I used Figma, which was quite a pleasant design experience. Simulating mouse over, mouse in, mouse out behaviors is possible. Besides, their paid plan makes copying CSS styles and SVGs easy with the Dev Mode. But even with the free plan, it feels like a breeze to export SVGs.
Building the User Interface
This project marked my metamorphosis into a fully-fledged software developer. This required me to learn Angular, a JavaScript framework, and its highly opinionated structure, which was perfect for my case.
Why did we choose Angular?
Many people believe that Angular is one of the most difficult frameworks for web development. If we compare it to React or Vue, for example, it does looks harder in the beginning. But the truth is that because Angular has a lot of built-in features (which means it is “opinionated”), it eliminates the need to make a lot of decisions later on. So, I could skip the most painful part for a solo learner: the mental exhaustion that can come from making too many choices. And believe me, decision fatigue is a real thing! In addition, Angular uses a programming language called TypeScript. Think of it as JavaScript with a code checker that helps catch errors before they become problems. Since I was the only person writing the code, TypeScript was a big safety net. In fact, I would only trust myself to develop this app with the guardrails that TypeScript creates. Remember that I had no code reviewer; I was a team of one on the software side. Another reason to choose Angular is its reputation for reliability and ease of maintenance, especially in large-scale applications. It is backed by Google, which have already built more than 2600 solutions with it, so it is clear that it can handle complex projects and will be maintained for a long time. With my background in architecture and engineering, I understand how quickly things can become complex in this field too, and even though the KfW Calculator seems simple at first, it includes around a couple of hundred variables and over a hundred functions in its first version. Given BuildSystems’ goal to create a scalable app that will evolve into a comprehensive early planning tool, Angular’s strengths were a perfect fit for this project.
AI Tools as a Copilot
This app was built between late 2023 and mid-2024, when AI coding assistants were still a novelty rather than a default part of every developer’s toolkit. Even so, ChatGPT played a crucial role in converting the Excel formulas into TypeScript code. For cutting-edge features, though, these tools did not give great answers, because the training data simply was not there yet.
Process
During the development process, I tried to create a single component that would accommodate both the New Building (Neubau) and the Renovation (Sanierung) calculator, making the code less repetitive following the principle of DRY (don’t repeat yourself). This, however, made the component too complex because there were many variables and requirements unique to each calculator. So in the end I decided to split it into two components. Although there is some redundant code, this added speed to the development.
%%{ init: { 'flowchart': { 'curve': 'basis' } } }%%
flowchart TB
	NC(Neubau Component) --> NPFC(Projekt Form Component) & NDFC(Darlehen Form Component)
		subgraph NPF[Projekt Form]
			direction TB
			NPFC --> NPFS(Projekt Form Service)
		end

		subgraph NDF[Darlehen Form]
			direction TB
			NDFC --> NDFS(Darlehen Form Service)
		end
	NDFS --> NS(Neubau Service)

	NPFS --> NS
	NS --> NPD(Projekt Dashboard)
	NS-->NPCHC(Charts Component)
	NPCHC-->NCHG(Gesamtkosten Chart)
	NPCHC-->NCHG2(Gesamtkosten m² Chart)
	NPCHC-->NCHE(Einheitskosten Chart)

	subgraph NPCH[Charts]
		direction TB
		NPCHC
		NCHG
		NCHG2
		NCHE
	end

	subgraph NPOUT[Output Projekt]
		direction TB
		NPD
		NPCH
	end

	NS-->NDD(Darlehen Dashboard)
	NS-->NDCHC(Charts Component)
	NDCHC-->NCHA(Annuitäten Chart)
	NDCHC-->NCHF(Finanzierungskosten Chart)
	NDCHC-->NCHT(Tilgung Chart)
	subgraph NDOUT[Output Darlehen]
		direction TB
		NDD
		NDCH
	end

	subgraph NDCH[Charts]
		direction TB
		NDCHC
		NCHA
		NCHF
		NCHT
	end

	NS-->NSV(Save Option)

	NPF:::paddingNPF
	NDF:::paddingNDF
	NPCH:::paddingNPCH
	NDCH:::paddingNDCH
	NDOUT:::paddingNDOUT
	classDef paddingNDCH padding-right:34em;
	classDef paddingNPCH padding-right:37em;
	classDef paddingNPF padding-right:9em;
	classDef paddingNDF padding-right:9em;
The strategies used to implement the features also varied throughout the development because as I progressed, I learned new and improved ways to achieve the same result. For example, the implementation of the forms changed twice already. The first time I decided to refactor the whole code to make sure everything was homogeneous and had a more clear code. That, however, turned out to be a poor product management decision, because the features were already working and although the code was a bit confusing, changing the internals would not affect the end user at all. So for the second change, which is happening for the second version of the app, I won’t be refactoring the rest of the code. If you want to learn more about how I am currently implementing the forms, check out this article by Zoaib Khan.
Testing and Quality Assurance
I also went down the rabbit hole on the topic of unit testing using the default Karma tool. This type of testing checks small parts (units) of the software to make sure each one works correctly on its own. Unfortunately, though, I could only learn this at a late stage, which meant I had to refactor the code to allow the unit tests to work. Besides, if I had to start over, I would instead focus my energy on end-to-end testing (E2E) using Cypress. This test checks the whole system by simulating user interaction, ensuring inputs and outputs match our due diligence.
Deployment
We initially deployed the app on Netlify because they have a super smooth experience. Their business model is “pay as you scale” with no initial costs. Besides, it is a no-code deployment solution; you just connect your GitHub repo, and they do the rest! However, some Netlify users started to spread how they went from the free plan to being charged tens of thousands of dollars, or even $104K in a month. All because of a DDOS attack that could happen to anyone. Because Netlify did not have a DDOS attack prevention mechanism, we decided to move to Cloudflare. Cloudflare is similar to Netlify. Same business model and automated deployment using GitHub. However, it does have a more robust anti-bot system. The deployment is automatic and quite simple:
%%{ init: { 'flowchart': { 'curve': 'basis' } } }%%
flowchart LR
NG(Angular) --push--> MA(main branch) --> CP(CF pages production) --> PA(https://app.buildsystems.de)
NG --push--> DV(development branch) --> CD(CF pages development) --> DA(https://branchname.pages.dev)

subgraph VS[VS Code]
	NG
end

subgraph GH[GitHub]
	MA
	DV
end

subgraph CF[Cloudflare]
	CP
	CD
end
Ensuring a Smooth App Development: Key Insights and Strategies
- Security First: Prioritize data security from the beginning to avoid compliance issues later.
- Early Planning: Invest time in planning and understand the requirements you need before starting the development.
- AI Tools: In 2023 reaching for AI was not yet the default it is today, but the lesson from this project is clear: use code copilots from day one, and let AI generate first-pass UI designs to start from.
- Flexibility: Be aware that the app will evolve, so don’t adhere too strictly to the DRY principle.
- Framework Selection: Choose a framework that suits your project’s needs and stick with it. Usually, the best framework is the one you already know.
- Continuous Testing: bet your testing efforts on end-to-end testing. One of the main challenges was to make the app “snappy”; in other words, while the user moves a slider, all the values and charts are updated in real-time. Also, we were cautious about the users’ data because of the super restrictive EU regulations. The first decision was to avoid server-side calculations altogether. The whole app is client-side only, which means that once it is loaded, it doesn’t have to send data anywhere; the calculation happens directly on the device. That means we also didn’t have to worry about data storage for the first version. Designing the app from scratch was a valuable experience. In 2023, AI design tools were only beginning to emerge, but today I would start the UI design with an AI assistant. Tools like Galileo AI or Rendition Create can produce a nice first-pass app interface from prompts (Text to UI). Starting with a UI draft is always faster, even if the draft changes drastically.
Supabase backend
We also shipped the second version of the app, which added another calculator alongside features like saving a project and comparing two projects. The data layer is built on Supabase; the schema below shows how projects, users, and edit history are modeled.
erDiagram
    auth_users {
        uuid id
    }

    neubau_projects {
        bigint id
        text title
        uuid created_by
        timestamp created_at
        uuid owned_by
        uuid last_edited_by
        timestamp last_edited_at
        text other_project_values
    }

    sanierung_projects {
        bigint id
        text title
        uuid created_by
        timestamp created_at
        uuid owned_by
        uuid last_edited_by
        timestamp last_edited_at
        text other_project_values
    }

    einzelmassnahmen_projects {
        bigint id
        text title
        uuid created_by
        timestamp created_at
        uuid owned_by
        uuid last_edited_by
        timestamp last_edited_at
        float vollkosten
        float bafa_foerderung
    }

    user_neubau_projects {
        bigint id
        uuid user_id
        bigint project_id
    }

    user_sanierung_projects {
        bigint id
        uuid user_id
        bigint project_id
    }

    user_einzelmassnahmen_projects {
        bigint id
        uuid user_id
        bigint project_id
    }

    einzelmassnahmen_items {
        bigint id
        bigint project_id
        text title
        int position
    }

    einzelmassnahmen_values {
        bigint id
        bigint item_id
        bigint project_id
        text title
        float value
        text unit
        int position
    }

    auth_users ||--o{ neubau_projects : "created by"
    auth_users ||--o{ neubau_projects : "owned by"
    auth_users ||--o{ neubau_projects : "last edited by"
    auth_users ||--o{ sanierung_projects : "created by"
    auth_users ||--o{ sanierung_projects : "owned by"
    auth_users ||--o{ sanierung_projects : "last edited by"
    auth_users ||--o{ einzelmassnahmen_projects : "created by"
    auth_users ||--o{ einzelmassnahmen_projects : "owned by"
    auth_users ||--o{ einzelmassnahmen_projects : "last edited by"
    auth_users ||--o{ user_neubau_projects : "has many"
    auth_users ||--o{ user_sanierung_projects : "has many"
    auth_users ||--o{ user_einzelmassnahmen_projects : "has many"
    neubau_projects ||--o{ user_neubau_projects : "has many"
    sanierung_projects ||--o{ user_sanierung_projects : "has many"
    einzelmassnahmen_projects ||--o{ user_einzelmassnahmen_projects : "has many"
    einzelmassnahmen_projects ||--o{ einzelmassnahmen_items : "contains many"
    einzelmassnahmen_projects ||--o{ einzelmassnahmen_values : "contains many"
    einzelmassnahmen_items ||--o{ einzelmassnahmen_values : "contains many"